What an enjoyable excercise

It's been a while since I've flown any of our B707's.
It's lucky I had/made time to be able to do it at all today though .... it won't hurt other HJG work to be delayed by 1 more day I guess

ANYWAY .... here's my test report ....
I took our B707-320C up to 39,000 FT .... and prior to getting there (and back down again) here's the observations I've recorded ....
FUEL FLOW & ENGINE SPEED AT GROUND IDLE
F/F = 642 LBS
Engine N1/N2 = N1 28.7% / N2 59.3 %
I loaded my B707-320C as for a MGW departure .... based on a "full payload" and then the following fuel (only) adjustment ....
FUEL & PAYLOAD
LEFT AUX = 100%
LEFT = 95%
CENTER = 92.3%
RIGHT = 95%
RIGHT AUX = 100%
CENTER 2 = 100%
CENTER 3 = 100%
With no payload adjustment the above fuel loading resulted in a 20 LB overload prior to taxi .... "stuff all"
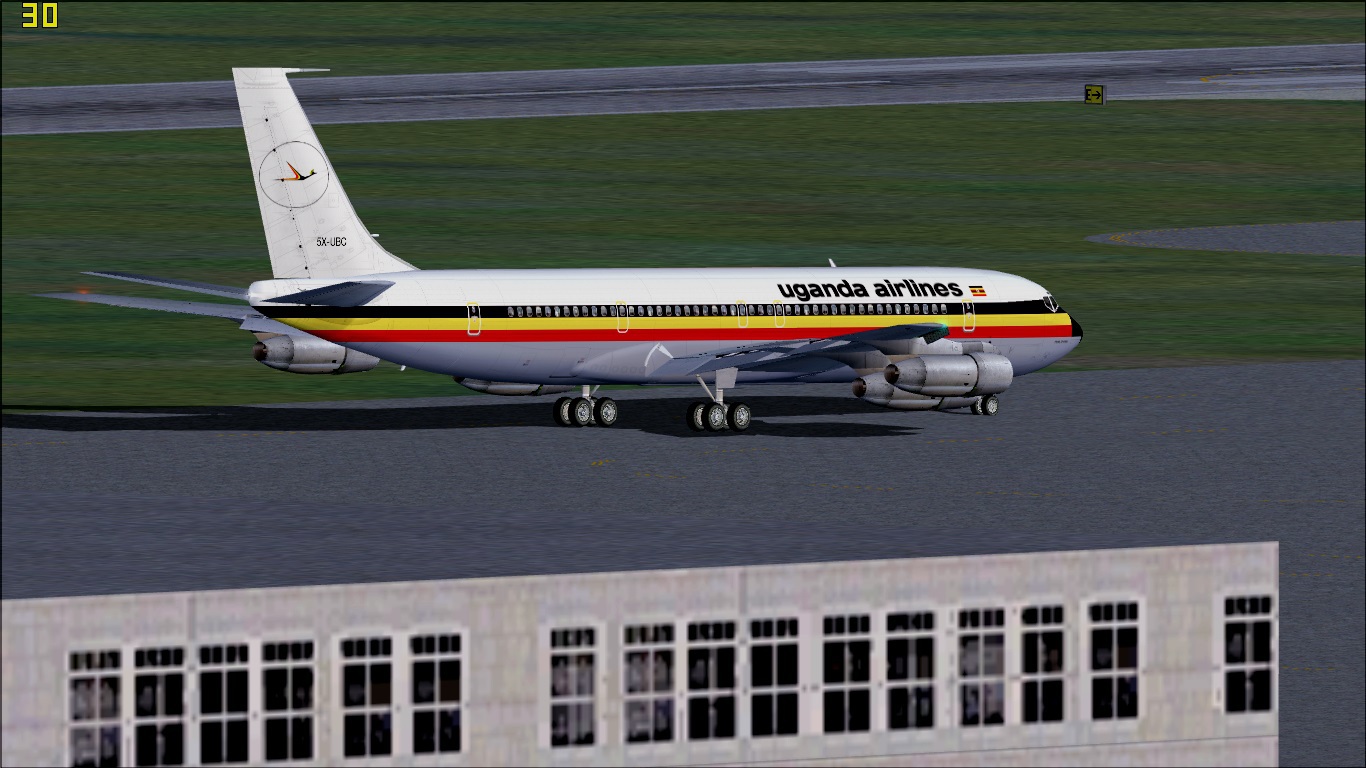
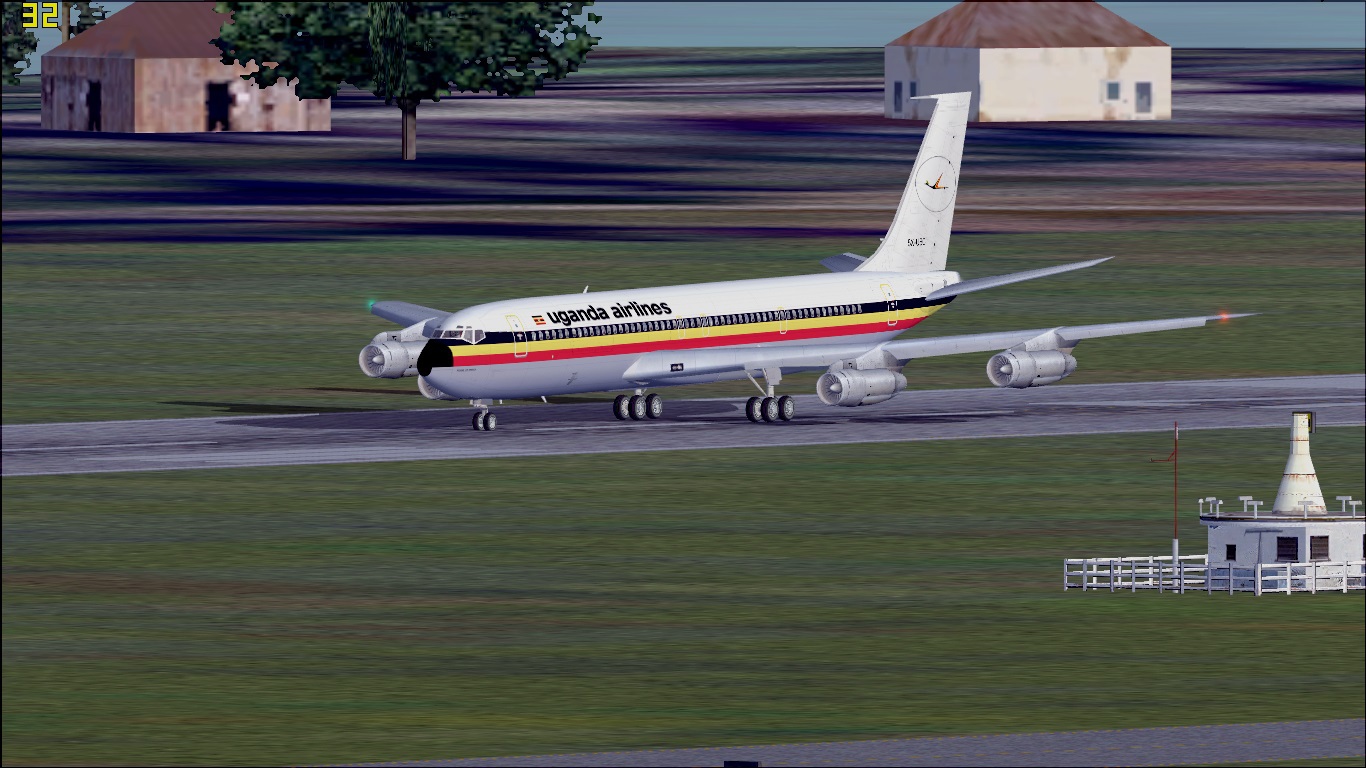
For my B707-320C, and this test, I opted to use our classic 1965 B707-320B ADV/B707-320C configuration.
Prior to departure the simulation was configured as follows ....
TRIM = 3 units
T/O FLAP SETTING = 23* (2X notches)
T/O V-speeds were calculated as follows ....
V1 = 148 KTS (at MGW)
VR = 155 KTS (at MGW)
V2 = 170 KTS (at MGW)
V-REF = 158 KTS (at MGW)
MAX T/O THRUST = N2 100%
MAX T/O THRUST F/F = 8,200 LBS
The above T/O power and F/F indications will vary in accordance with airport altitude and weather temperature environments.
Following T/O the simulation was flown approximately as follows ....
INITIAL CLIMB RATE = 1,500 FPM (prior gear/flap retraction)
FLAP 23* RETRACT SPEED = 200 KIAS
FLAP 14* RETRACT SPEED = 220 KIAS
AFTER T/O (after clean-up) CLIMB THRUST REDUCTION = N2 92.5% .... and the ROC then increased to 2,500 FPM
The simulation was then climbed approximately in accordance with the following alltitude, ROC, and power adjustment schedule ....
- Maintain 2,500 FPM ROC and approx N2 92.5% until 10,000 FT
- 10,000 FT reduce ROC to 2,000 FPM - maintain approx N2 92%
- 20,000 FT reduce ROC to 1,800 FPM - maintain approx N2 91%
- 24,000 FT reduce ROC to 1,500 FPM - maintain approx N2 90%
- 27,000 FT reduce ROC to 1,200 FPM - maintain approx N2 89%
- 30,000 FT reduce ROC to 1,000 FPM - maintain approx N2 88%
- 30,200 FT reduce ROC to 800 FPM - maintain approx N2 87%
- 30,500 FT reduce ROC to 500 FPM - maintain approx N2 86%
- 30,800 FT reduce ROC to 200 FPM - maintain approx N2 85%
- 31,000 FT ALT CAPTURE - maintain approx N2 84%
At 31,000 FT flight performance was noted as follows ....
IAS = 314 KTS
MACH = 0.82.1
TAS = 484 KTS
EPR = 1.33
N1 = 79.6%
EGT = 398*C
N2 = 84.3%
F/F = 2,557 LBS (X4 = 10,228 LBS per hour in total)
AI Pitch = +1*
At 35,000 FT flight performance was noted as follows ....
IAS = 286 KTS
MACH = 0.82.1
TAS = 472 KTS
EPR = 1.38
N1 = 81.4%
EGT = 380*C
N2 = 89.4%
F/F = 2,315 LBS (X4 = 9,260 LBS per hour in total)
AI Pitch = +2*
The increased AI pitch attitude was undoubtedly a result of the simulations weight being being in excess that desirable for this cruising altitude .... at a reasonably early stage following departure.
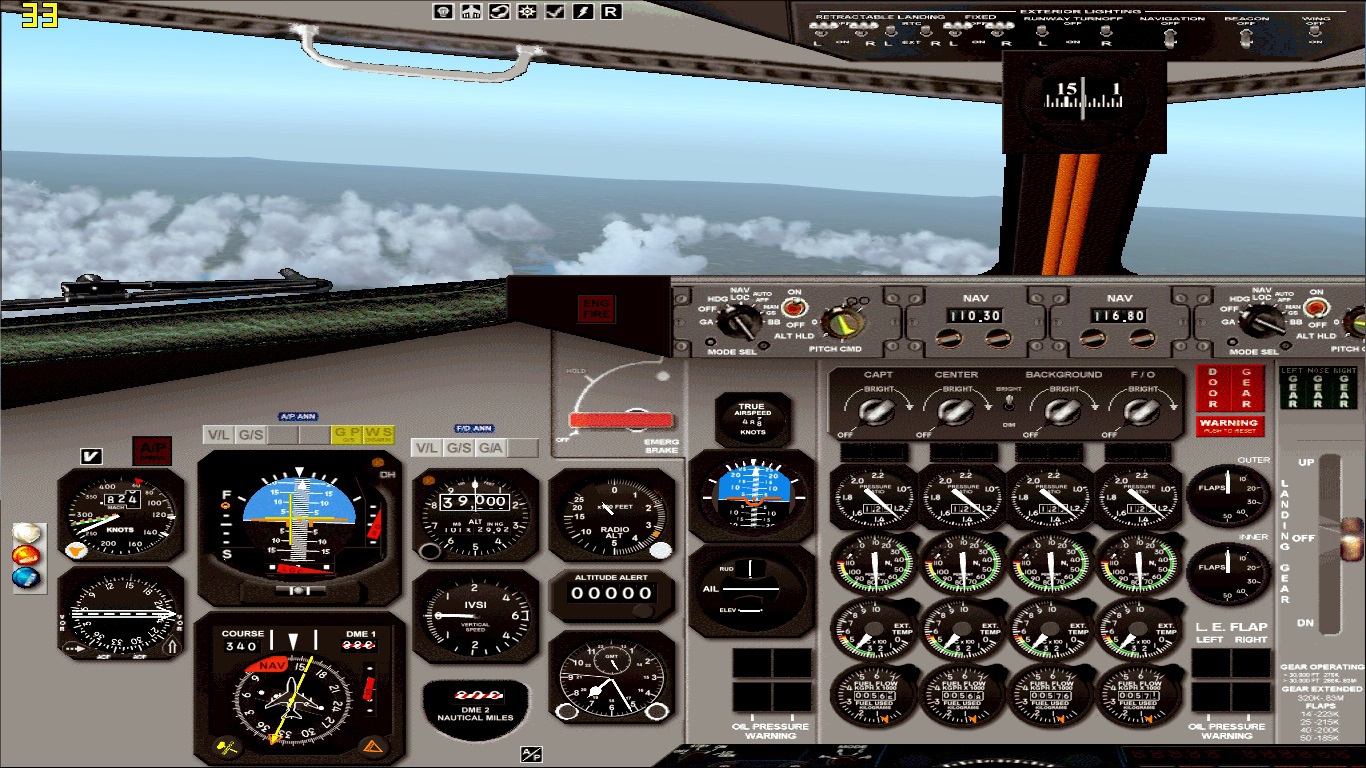
At 39,000 FT flight performance was noted as follows ....
IAS = 257 KTS
MACH = 0.81.6
TAS = 467 KTS
EPR = 1.43
N1 = 83.7%
EGT = 378*C
N2 = 85.5%
F/F = 2,046 LBS (X4 = 8,184 LBS per hour in total)
AI Pitch = +3*
Again .... the further increased AI pitch attitude was undoubtedly a result of the simulations weight being being in excess that desirable for this cruising altitude. I therefore simulated a significant fuel burn-off .... to approximare what should be the case prior to TOD .... and noted the following flight performance ....
IAS = 262 KTS
MACH = 0.82.8
TAS = 474 KTS
EPR = 1.40
N1 = 81.9%
EGT = 376*C
N2 = 84.5%
F/F = 1,070 LBS (X4 = 7,880 LBS per hour in total)
AI Pitch = +1*
The airspeed and F/F improvements are a direct result result of signifant weight reduction .... as should be expected close to TOD and nearing the end of any flight.
Simulated weather envvironents and less than MGW operations will likely influence the above recorded performance observations
IN SUMMARY ....
On the basis of how I load, and fly, our B707's (and most of our other simulations too) I can't see anything abnormal .... in either performance or F/F indications for power setting, altitude, and simulated weather environment too.
I'm comfortable endorsing all is well .... but .... these simulations do need to be flown properly in order to be able to perform correctly of course
It needs to be noted though that our B707 FDE's are, by now, among our oldest .... and are due for an overhaul. This was actually commenced, by me, early last year (or it might have been a bit earlier) .... in particular to improve landing attitude/performance of these simulations, but, has had to be shelved due to other HJG priorities both during the past 12 months and currently.
Here's a few images from this/my test flight of today


Mark C
AKL/NZ